
"Canadians are worse off today than they were a year ago. The government is spending at record levels and taxes are higher, yet more people are unemployed and there are fewer full−time jobs." — interim Conservative leader Rona Ambrose.
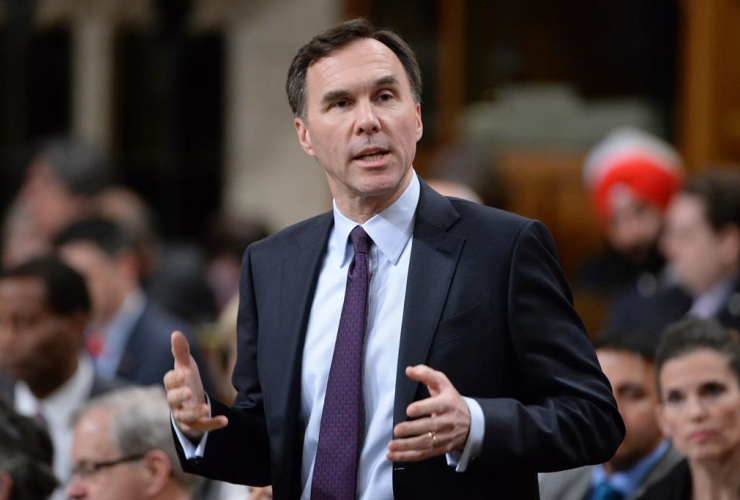
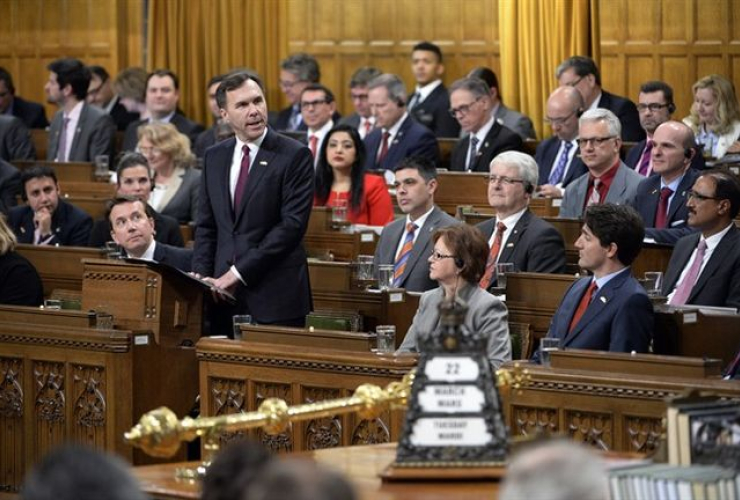
Soon after Finance Minister Bill Morneau tabled his fall economic statement Tuesday in the House of Commons, the Conservatives issued a news release insisting that the Liberal government is headed in the wrong direction when it comes to economic growth.
But is the Tory scenario of economic doom and gloom really true? Let’s break it down into its five separate parts.
Spoiler alert: The Canadian Press Baloney Meter is a dispassionate examination of political statements culminating in a ranking of accuracy on a scale of "no baloney" to "full of baloney" (complete methodology below).
This one earns a rating of "a lot of baloney" — the statement is mostly inaccurate but contains elements of truth. Here’s why.
Are Canadians worse off today than they were a year ago?
In order to avoid delving into the philosophical (what does "worse off" really mean, anyway?), let’s look at the nominal gross domestic product (GDP) per capita now and compare it to what it was a year ago. By that measure, Canadians are technically a little worse off than they were a year ago, but the difference is small enough that it could be considered a wash.
Matthew Stewart, associate director with the national forecast and custom analysis division of the Conference Board of Canada, said nominal GDP per capita was $55,228 for the second quarter of fiscal 2016−17, down from $55,360 in the same period of fiscal 2015−16.
That’s a decrease of $132 per person, and a slightly smaller drop than the $173 for the previous year — the last year the Conservatives were in power.
Is the government spending at record levels?
Projected program spending for fiscal 2016−17 was $291.3 billion, more than $270.8 billion in the previous year and the most any federal government has devoted to total program spending since fiscal 1966−67, which is as far back as the latest fiscal reference tables from Finance Canada go. That said, direct program spending has gone up almost every year.
A better measure is federal spending as a share of GDP. Morneau’s fall economic statement showed that program expenses are projected to be 14.4 per cent of GDP — up from last year’s 13.7 per cent, but definitely not a record.
In fact, it’s lower than the 15.8 per cent during the Conservative government’s stimulus budget years of fiscal 2009−10, and 14.6 per cent in fiscal 2010−11. The lowest the Conservatives had it was in fiscal 2006−07, their first year of government, at 12.8 per cent.
Historically, the highest it ever reached was 20.6 per cent in fiscal 1982−83.
Are taxes higher?
This one is a bit tricky. The Liberal government lowered taxes for wage−earners making between $45,282 and $90,563 per year while raising taxes on the wealthy, so they would argue it’s a matter of who, exactly, is paying more taxes.
The Conservatives, meanwhile, say they based this assertion on things like an increase in Canada Pension Plan premiums, the phasing out of so−called boutique tax credits for things like kids’ arts and fitness activities and the Liberal decision to stand pat on corporate taxes for small businesses.
To help cut through the political rhetoric, Stewart took a look at federal personal income taxes as a percentage of household income. He found people are paying slightly more in federal income taxes, on average, compared to a year ago — but again, just barely.
Using Statistics Canada data, Stewart calculated it was 10.34 per cent in the second quarter of fiscal 2016−17, compared to 10.31 per cent in the second quarter of 2016, an increase of 0.03 percentage points.
"It’s up — very, very marginally," he said.
Are more people unemployed?
The most recent Labour Force Survey from Statistics Canada shows that in terms of real numbers, 138,800 more people were employed in September 2016 than they were in the same month last year. The employment rate, however, did decrease by 0.1 percentage points over that same period.
The Conservatives based this claim on the job numbers in three major industries: natural resources, where 35,200 fewer people had work; manufacturing, down 12,200 people; and agriculture, down 3,800.
Are there fewer full−time jobs?
That same jobs survey showed an increase of 50,200 people with full−time employment in September 2016 compared to a year earlier. Still, as a percentage of overall increase in employment, the numbers show that most of the gains were in part−time employment, which increased by 88,500 people.
While part−time employment was up by 2.6 percentage points year over year, full−time employment rose by only 0.3 percentage points. The Conservatives also point to the 2016 labour market assessment released last month by the parliamentary budget office.
It said the Canadian economy created 96,000 net new jobs from the third quarter of 2015 to the third quarter of 2016, an increase of 0.5 per cent, smaller than the average annual gain of 192,000 net jobs during the last five years the Conservatives were in power.
It also noted that all employment gains were from part−time employment, which increased by 102,000 between the third quarter of 2015 and the third quarter of 2016, while full−time employment fell by 6,000 over the same period.
The report said the previous five years had full−time employment accounting for all the growth.
The verdict
By the most basic, and admittedly, crudest, of measures — GDP per capita — then it is only technically accurate to say Canadians are worse off than they were a year ago, given the paltry $132 difference. The other factors in the Conservative calculations also do not bear much scrutiny, especially when it comes to "spending at record levels."
For that reason, Ambrose’s statement earns a ranking of "a lot of baloney": the statement is mostly inaccurate but contains elements of truth.
Methodology
The Baloney Meter is a project of The Canadian Press that examines the level of accuracy in statements made by politicians. Each claim is researched and assigned a rating based on the following scale:
No baloney — the statement is completely accurate
A little baloney — the statement is mostly accurate but more information is required
Some baloney — the statement is partly accurate but important details are missing
A lot of baloney — the statement is mostly inaccurate but contains elements of truth
Full of baloney — the statement is completely inaccurate
SOURCES
— Fall Economic Statement, 2016
— Statistics Canada, Labour Force Survey, September 2016
— Finance Canada, Fiscal Reference Tables, October 2016
— Parliamentary Budget Officer, Labour Market Assessment 2016
Keep reading
Comments