“The accumulation of CO2 in the atmosphere is irreversible on human timescales and will affect climate for millennia.” — World Meteorological Organization (WMO)
Despite decades of global efforts to prevent a full-blown climate crisis, the primary driver of it — CO2 — continues to pile up in our atmosphere at an accelerating rate. And last year’s CO2 rise was record-busting extreme.

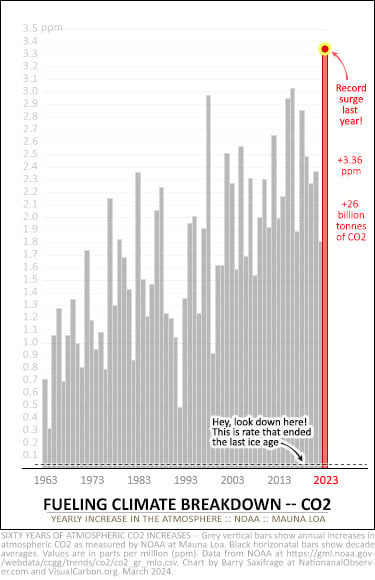
My first chart shows the latest data from the National Oceanic and Atmospheric Administration (NOAA). Grey bars mark the CO2 increase for each of the last 60 years. And I’ve highlighted 2023’s ”off-the-charts” surge in red.
Last year, CO2 increased by 3.36 parts-per-million (ppm). That’s a 10 per cent greater jump than the previous record, which was set just a few years ago.
In sheer weight, last year’s surge added a record 26 billion tonnes of CO2 to the atmosphere — more than three tonnes per human.
On the micro-scale, around 84 trillion new molecules of CO2 were added to every cubic centimetre of Earth’s atmosphere last year. A cubic centimetre is roughly the size of a sugar cube. (Note: For details on atmospheric CO2 math, see the endnotes.)
And for a deep-time comparison, take a look at the dashed line on the chart, way down at the bottom. That’s the rate that cooked away the Earth’s last ice age,

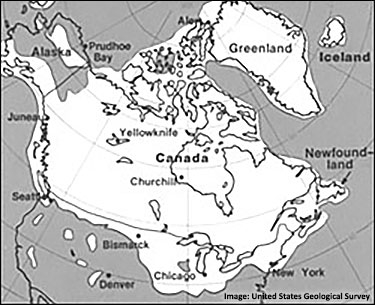
During the last ice age, around 20,000 years ago, all of Canada was buried beneath a massive northern ice cap. The ice was two miles thick over the Montreal region, and a mile thick over Vancouver. So much water was locked up in ice that global sea levels were 125 metres (410 feet) lower. We are talking a lot of ice and a radically different climate.
As NOAA highlighted: “The rate of CO2 growth over the last decade is 100 to 200 times faster than what the Earth experienced during the transition from the last ice age. This is a real shock to the atmosphere.”
Accelerating away from climate safety
As you may have noticed, the chart’s grey bars shift a lot from year to year. This is mostly caused by short-term fluctuations in how much CO2 global plants and oceans absorb each year.

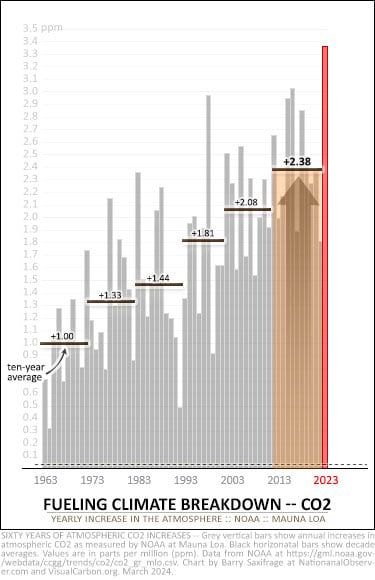
So, to better show the underlying long-term trend, NOAA uses decade averages. I’ve added these 10-year averages to my chart as a series of black horizontal bars.
For example, during the first decade shown on the chart — 1963 to 1972 — atmospheric CO2 increased an average of 1.00 ppm per year. That’s the left-most black bar.
Notice how those black bars have marched ever higher? They’ve shrugged off three decades of global climate conferences trying to slow them down — to reach a blistering average of 2.38 ppm per year during the previous decade.
And that doesn’t even include last year’s epic surge.
As this chart clearly shows, the annual increases are increasing. When increases are increasing, you’re accelerating. And when you are doing that with the primary control knob of the Earth’s climate — CO2 — you’re accelerating away from climate stability and safety.
Net zero?
To stop the climate crisis (and its evil twin, ocean acidification) from growing increasingly extreme and dangerous, CO2 levels in the atmosphere must stop rising.

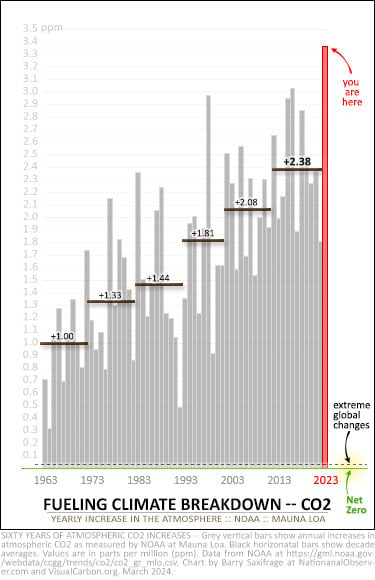
That point when CO2 stops increasing is called “net zero” and it is literally the zero line at the bottom of the chart. I’ve highlighted this zero-CO2-increase line in green.
Net zero is one of those bright-line targets. Getting close isn’t enough.
To understand why, look again at that dashed line just above it.
As we saw above, even CO2 increases this small were enough to radically alter the global climate. That rate melted Canada-sized ice sheets, inundated coastlines, and forced major ecosystems to migrate thousands of kilometres or perish.
And yet Canada, all by itself, is currently emitting far more CO2 each year than that dashed line.
So, it’s net zero or bust.
Which will it be?
-------------------
ENDNOTES
Interested in doing some geeky CO2 math? Here are the rough rules of thumb I used in my back-of-the-envelope calculations.
Molecules of CO2
- A cubic metre of air contains approximately 25 million million trillion (1024) molecules (source).
- Each cubic metre contains one million cubic centimetres (cm3). So, each cubic centimetre contains around 25 million trillion (1018) molecules.
- One part per million (ppm) of that = 25 trillion (1012) molecules.
- Adding 3.36 ppm to the atmosphere requires adding roughly 84 trillion molecules to each cubic centimetre (25 trillion * 3.36).
Weight of CO2
- It takes 7.81 billion tonnes of CO2 (GtCO2) to increase atmospheric CO2 by one ppm (source).
- The weight of 3.36 ppm of atmospheric CO2 is roughly 26 GtCO2 (7.81 GtCO2 * 3.36).
Bonus geek-out — Did you know that each kilogram of fossil fuel CO2 we emit adds another molecule of CO2 to every cubic centimetre of the atmosphere? Here’s the math:
- Avogadro’s constant says that 44 grams of CO2 contains around 6 x 10²³ CO2 molecules. So, each kilogram of CO2 (kgCO2) contains around 1.37 x 1025 CO2 molecules.
- Roughly 44 per cent of CO2 emitted stays in the atmosphere. The rest is absorbed fairly equally by the ocean (ocean acidification) and increased photosynthesis.
- So, for each kilogram of CO2 emitted, around 6 x 1024 CO2 molecules stay in the air. That’s roughly the number of cubic centimetres in the atmosphere!
- The “effective volume” of the atmosphere is around 4.2 billion cubic kilometres (source), which is 4.2 x 1024 cubic centimetres.
- Burning a single litre of gasoline emits 2.4 kgCO2. That’s enough to add around three CO2 molecules to every cubic centimetre of the planet’s atmosphere. Oh, and the part absorbed by the oceans adds around six CO2 molecules to every cubic centimetre of the world’s oceans. That gives a whole new meaning to “fill ’er up!”
That's some wild and woolly
That's some wild and woolly arithmetic.
Now check out PM Trudeau's math.
The Liberals' solution to global warming is to sell more of Canada's fossil fuels to the world. Hence, new oilsands export pipelines (TMX) and LNG projects.
The more fossil fuels we extract and sell, the faster we can reduce our emissions. The new math.
If that does not work, a little creative accounting will take care of it. Simply undercount our emissions and global warming goes away. The power of mathematics.
Meanwhile, Canada's forests continue to burn.
Easily solved. Just plant a billion trees. Isn't math fun?
Trudeau: "Buying the Trans Mountain pipeline wasn't about hoping to turn a profit for the government. It was about making sure that Alberta crude was not landlocked and was not prisoner to one single customer in the United States.
"I took a lot of grief across the country for buying a pipeline. But I knew that if we want to be able to pay for the innovation, the transformation of our economy to be greener, to be cleaner, we need to get the best possible price for our oil products now, and that means getting out across the Pacific. That meant twinning the Trans Mountain pipeline.
"That's why we bought the pipeline, because it was good for Alberta and it's good for the country."
"Braid: Trudeau doesn't look like a Prime Minister who's ready to quit" (Calgary Herald, 21-Feb-24)
Elementary, my dear Watson.
Today's Observer article on
Today's Observer article on federal subsidies to the O&G sector makes for even more fun math. O&G subsidies undermine carbon pricing:
"Over the last four years, the federal government's total financial support to the oil and gas industry was at least $65 billion. … The $65 billion in financial support to the oil and gas sector could have fully funded every major wind and solar project in Canada from 2019 to 2021 12 times over. (Environmental Defence report)
"Here’s how much the feds handed fossil fuel companies last year" (National Observer, 27-Mar-24)
https://www.nationalobserver.com/2024/03/27/news/how-much-feds-handed-fo...
And the "climate-sincere" Liberals are the sane party in this debate!
All that may be true. The
All that may be true. The real question is what is Poilievre going to do about climate change when Trudeau is turfed out of voter anger for being weak on climate change, not to mention affordable housing and other issues central in the minds of the electorate.
Trudeau = weakness on climate.
Poilievre = rage and chest thumping, silence on climate.
Is that supposed to be some kinda choice?


Comments