
Over the past five years, I have closely followed the signals of climate change, deciphering their significance through the frequency of temperature records and the escalating intensity of wildfires.
At the beginning of July, I mapped out record temperatures that resulted in devastating wildfires in B.C., Alberta and Nova Scotia. It showed record heat that intensified in May and June.
Now with the most recent wildfires in the Northwest Territories and B.C. — the worst season on record — providing yet another reminder of that increasing intensity, I thought it was time to update the map to include July, which includes a 37.3 C reading at the Norman Wells weather station on July 8.
My analysis of data from the National Oceanic and Atmospheric Administration reveals a staggering revelation — more than 150 monthly temperature records have been broken across Canada this year.
As a global hot spot for 2023, Canada has witnessed an unseasonably mild winter followed by volatile spring temperatures, contributing to a cascade of events, including a heat wave on the West Coast, devastating wildfires in Alberta and tinderbox conditions in Quebec.
Monthly temperature records, meaning the highest temperature ever recorded at a given station for a given month, are measures for tracking and quantifying the effects of climate change.

The animated map you see above captures the relentless march of record-breaking temperatures across Canada, a striking illustration of the data from Jan. 1 through July 31, 2023. With each passing month, an increasing number of dots populate the map, illustrating the surge in temperature anomalies nationwide — climate change in action.
Behind each record is a community — like Yellowknife or Kelowna — coping with high temperatures, spelling consequences for agriculture, water security and the onset of a severe wildfire season.
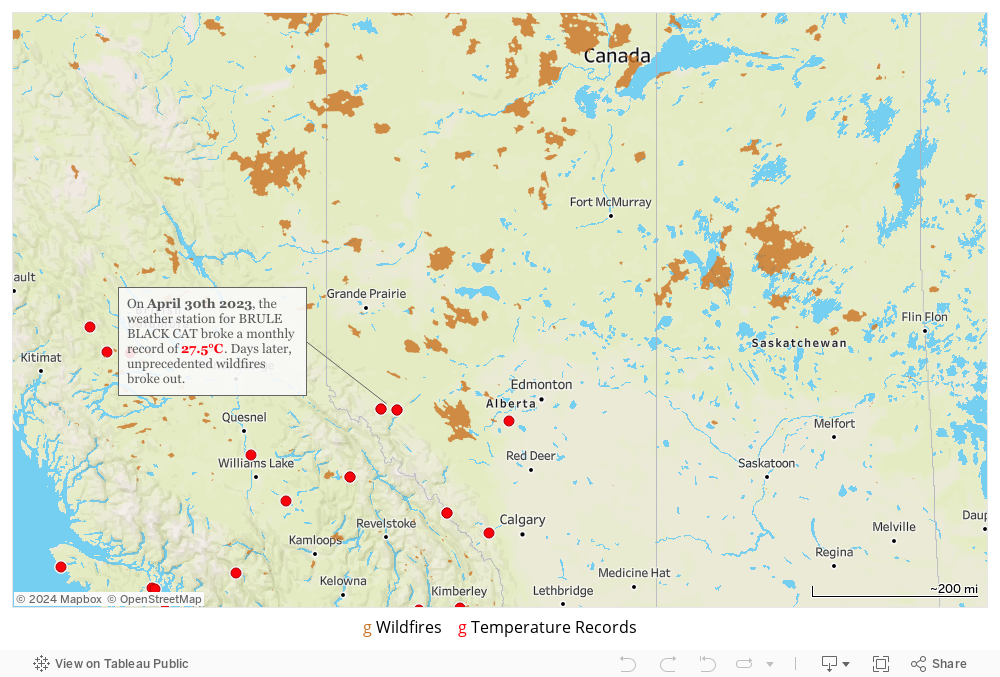
One of the regions profoundly affected by this alarming trend is Alberta. The close proximity of monthly records and the subsequent outbreak of devastating wildfires paint a clear picture of their obvious link.
Unusually high temperatures, coupled with low precipitation, create ideal conditions for ignition and the rapid spread of wildfires, causing swift damage to communities and infrastructure.
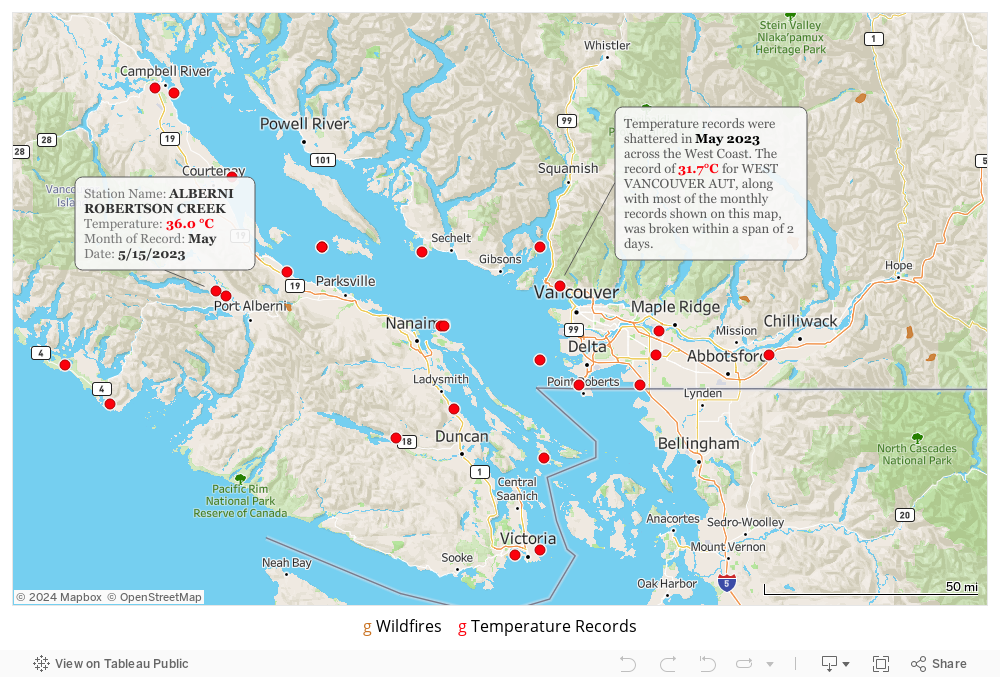
In May, the West Coast — as you can see in the map above — bore witness to an early heat wave, shattering several monthly records within a single week.
This region, renowned for its moderate climate, found itself in unfamiliar territory, grappling with temperatures well into the 30s that strained its residents. The uncommon heat wave harkened back to the extreme heat dome of 2021 when 619 people died due to heat-related causes.
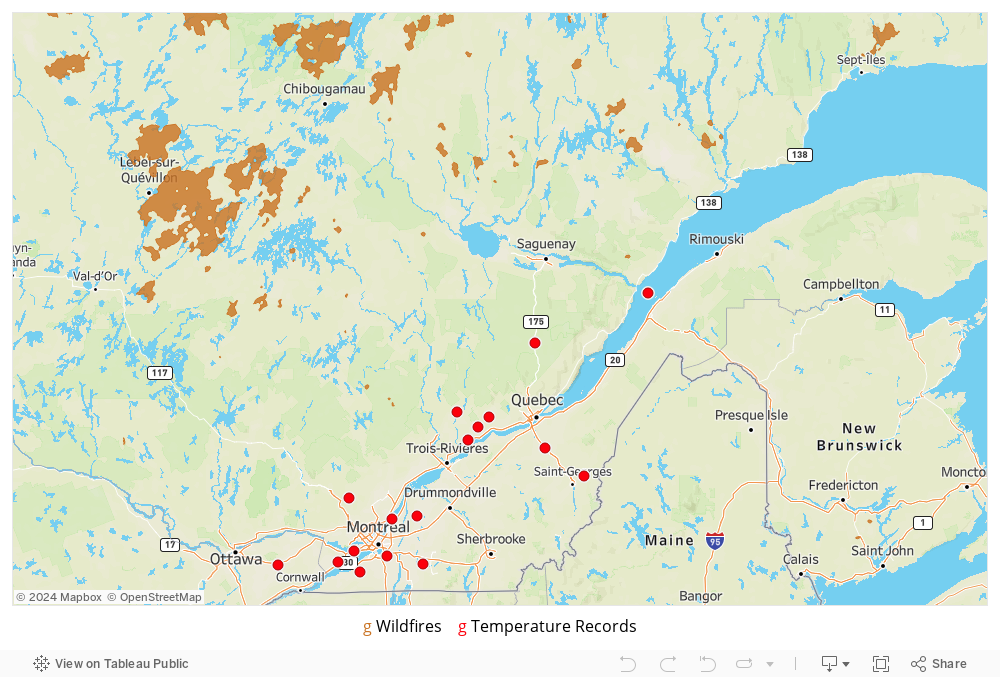
In Quebec, though fewer temperature records were broken, devastating wildfires occurred due to higher-than-usual temperatures and a winter marked by low precipitation.
Quebec’s surge in fire activity continues to cast waves of severe air pollution over major population centres like Ottawa, Toronto and New York City.
Its hazardous smoke is a global spotlight on Canada’s management of wildfires, along with the relatively unknown severity of the risk to public health.
In a stable climate, temperatures follow a general rhythm, oscillating between highs and lows. However, in our warming world, this balance is disturbed, with temperatures leaning noticeably toward record highs.
These monthly temperature records and neighbouring wildfires serve as a clear signal, pointing to an unsettling trend of increasing climate impacts.
Canada continues to stand in the international spotlight when it comes to climate change.
As I look to the signals of the future, I expect to witness a steady stream of climate-related events. This likely future underscores the importance of addressing climate change with urgency, determination and preparedness.
Methodology
Each point on the map represents a monthly temperature record, meaning the highest temperature ever recorded at a given station for a given month. To gather temperature data for Canada, we used a comprehensive database called the Global Historical Climatology Network (GHCN), which is maintained by the National Oceanic and Atmospheric Administration (NOAA). This database contains climate summaries from weather stations across the world, and all the temperature data came from stations managed by Environment and Climate Change Canada (ECCC).
We processed and analyzed the data using BigQuery.
NOAA collects and maintains the temperature measurements in the database to ensure data quality, consistency and accuracy. NOAA also incorporates quality checks from ECCC to further ensure data accuracy. Any observations that didn't meet the quality standards, such as unusually high or low measurements compared to the Earth's historical temperature records, were excluded from our analysis.
For each month, we identified the highest temperature recorded at each weather station. We only considered stations that had collected data for a minimum of 30 years to ensure the reliability of the records. We didn't combine data from different stations for cities or towns. Instead, we treated each station's observations as representative of the specific location where it was recorded. This means our records might differ from other sources that aggregate data from multiple locations, depending on the regions, stations and aggregations they considered.
Wildfire data is sourced from the Canadian Wildland Fire Information System. Data is as of 9 a.m. Eastern on August 16th 2023. Burned area perimeters are estimates based on satellite data.
Jamie Sandison is a data scientist who is passionate about climate change, news stories and data. Jamie studied climate communication and data visualization during his master's of science at uOttawa’s Institute of the Environment in 2022. He lives in Toronto.
Each point on the map represents a monthly temperature record, meaning the highest temperature ever recorded at a given station for a given month. To gather temperature data for Canada, we used a comprehensive database called the Global Historical Climatology Network (GHCN), which is maintained by the National Oceanic and Atmospheric Administration (NOAA). This database contains climate summaries from weather stations across the world, and all the temperature data came from stations managed by Environment and Climate Change Canada (ECCC).
We processed and analyzed the data using BigQuery.
NOAA collects and maintains the temperature measurements in the database to ensure data quality, consistency and accuracy. NOAA also incorporates quality checks from ECCC to further ensure data accuracy. Any observations that didn't meet the quality standards, such as unusually high or low measurements compared to the Earth's historical temperature records, were excluded from our analysis.
For each month, we identified the highest temperature recorded at each weather station. We only considered stations that had collected data for a minimum of 30 years to ensure the reliability of the records. We didn't combine data from different stations for cities or towns. Instead, we treated each station's observations as representative of the specific location where it was recorded. This means our records might differ from other sources that aggregate data from multiple locations, depending on the regions, stations and aggregations they considered.
Wildfire data is sourced from the Canadian Wildland Fire Information System. Data is as of 9 a.m. Eastern on August 16th 2023. Burned area perimeters are estimates based on satellite data.


Comments
What strikes me particularly is the preponderance of those data-capturing stations in or near large cities clustered around the country's southern border, and the vast areas most troubled with forest fires, that have no station near them.