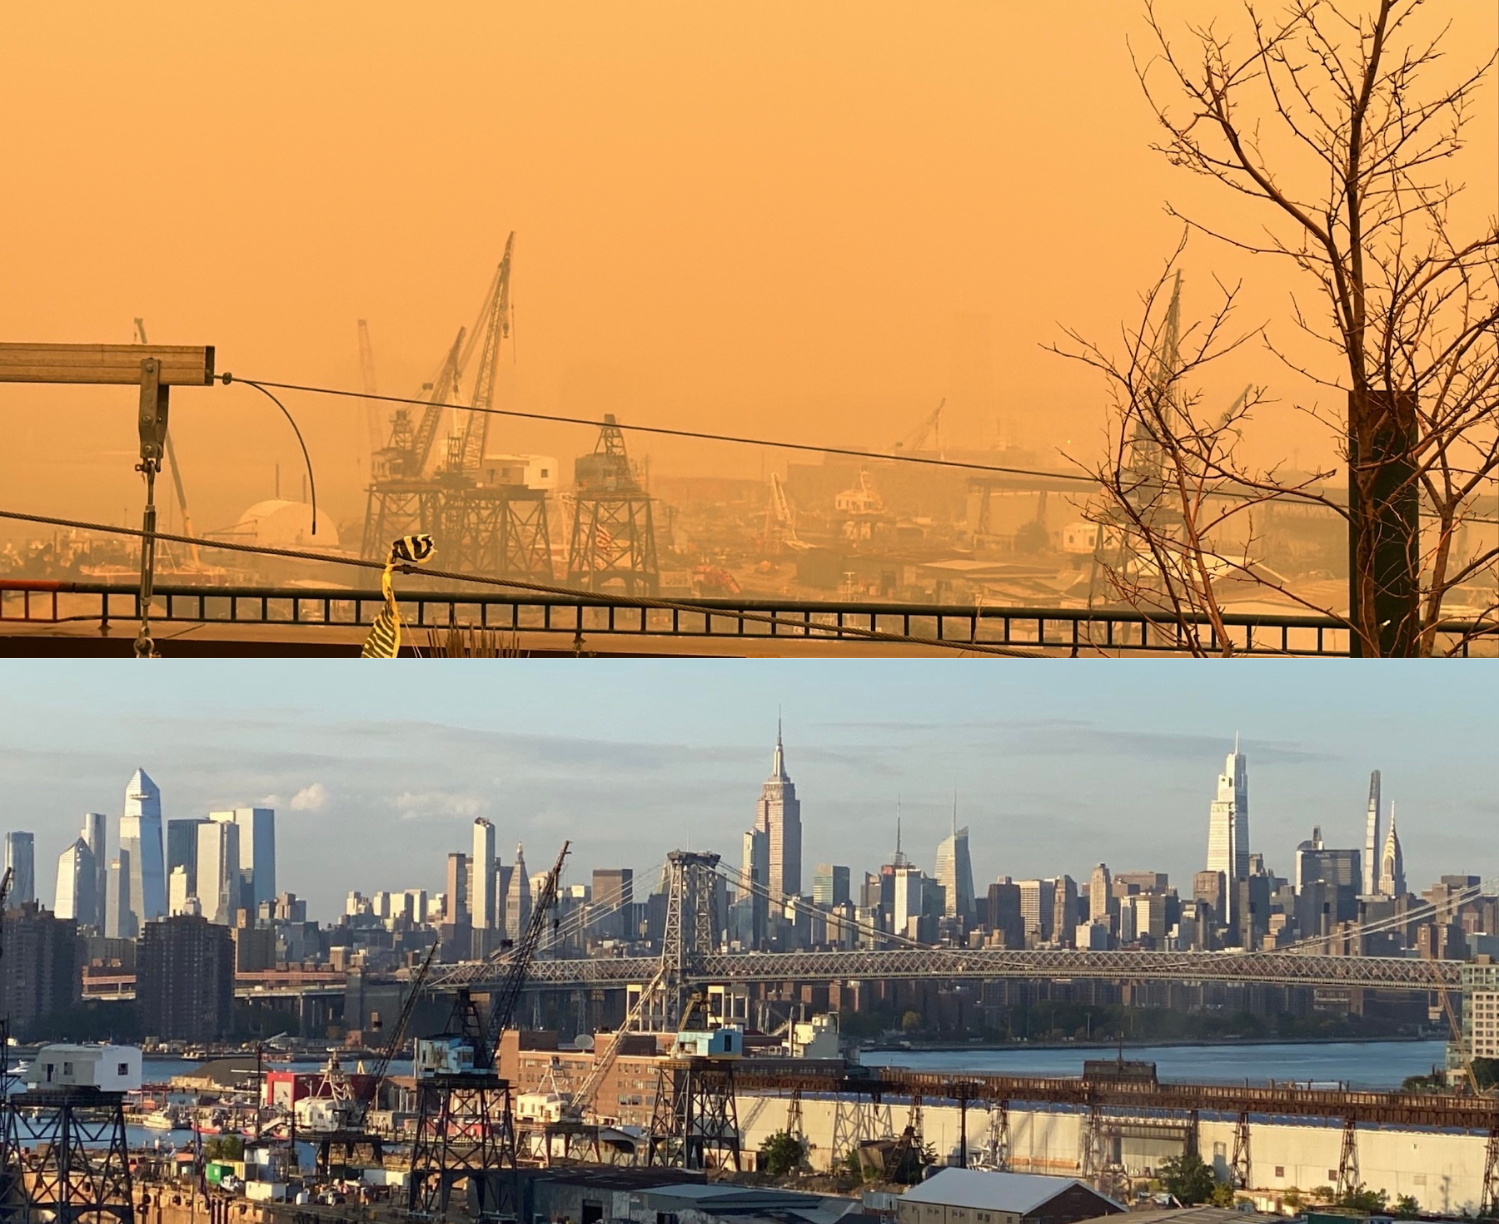
Canadians are worried about the rapidly metastasizing climate crisis. For good reason. The impacts are hitting harder and faster — like the hundreds of wildfires burning out of control all across our nation right now. Meanwhile, our emissions of climate-destabilizing greenhouse gases aren't going down enough to stop the climate chaos from growing ever more dangerous.
The sliver of good news in Canada is we've significantly reduced our climate pollution from electricity generation.
The bad news is we've been simultaneously cranking up our climate pollution in the rest of our economy and lives. Our success at cleaning up electricity has been hiding our failure to decarbonize everything else.
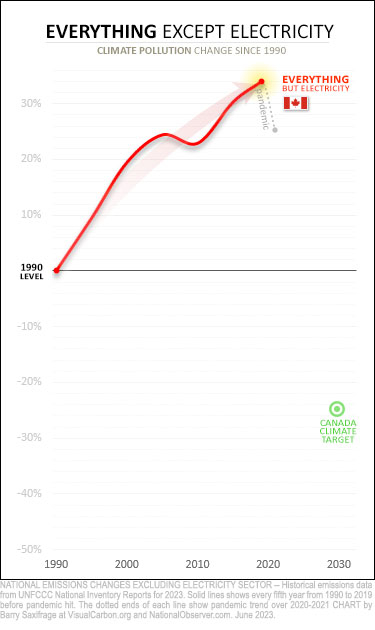
My first chart strips out the electricity sector to show you what is happening with all the rest of our emissions.
That rising red line contains all of Canada's climate pollution outside the electricity sector.
It's more than 90 per cent of our emissions. And they were record high and rocketing upwards when the pandemic temporarily knocked them down (the dotted grey line).
The primary reason the red line keeps surging higher is that Canadians keep burning larger amounts of fossil oil and fossil gas — in our homes, businesses, cars, trucks, ships, planes, farms, industry and almost all the rest of our economy and lives.
Does that red line look like Canada is heading toward zero emissions?
To me, it looks more like we are blindly accelerating into the oncoming climate train.
See that green bull's-eye in the chart's lower right? That's Canada's 2030 target under the global Paris Agreement. That's also along our path to the required net-zero emissions by 2050.
But, hey, isn't Canada just doing what our peers are doing — only cleaning up their electricity sectors? No. Take a look.
Compared to our G7 peers
To illustrate how Canada is doing compared to our peers, I dug up the same "everything except electricity" emissions data for the rest of the Group of Seven (G7) nations. Collectively, these wealthy industrialized nations emit one-third of global climate pollution and produce half the world's GDP. This is the group that has the resources and capacity required to lead the climate fight.
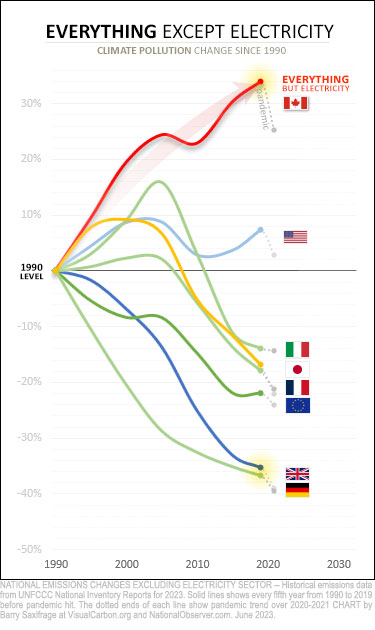
How's Canada doing?
As my next chart makes clear, we are embarrassingly in last place and heading in the wrong direction.
Germany, in contrast, has done the best in this group. What most people know about Germany's climate efforts is their multi-decade push to clean up their electricity sector — known as Energiewende. But the resulting huge electricity emissions cuts aren't even included on this chart. This chart only shows what they've done with their climate pollution in the rest of their economy — which is to reduce it by more than a third since 1990.
Our Commonwealth peers in the United Kingdom (U.K.) are close behind them. They are also best known for cutting coal from their electricity generation. But again, this chart ignores that and shows they cut emissions by more than a third across the rest of the economy.
Heck, even the Americans are doing far better than Canadians. A common — but wrong — sentiment I often hear in Canada is that the only reason the Americans are doing better than us on climate is because they have so much coal-fired electricity that is easy to clean up and we don't. But as this chart shows, we are doing much worse than the Yanks on everything outside the electricity sector as well.
Canada's breakdown
To wrap up, let's dig down into the data one more level to compare sector emissions for the group leaders (Germany and the U.K.) and the laggard (Canada). These are three of the world's top 10 economies.
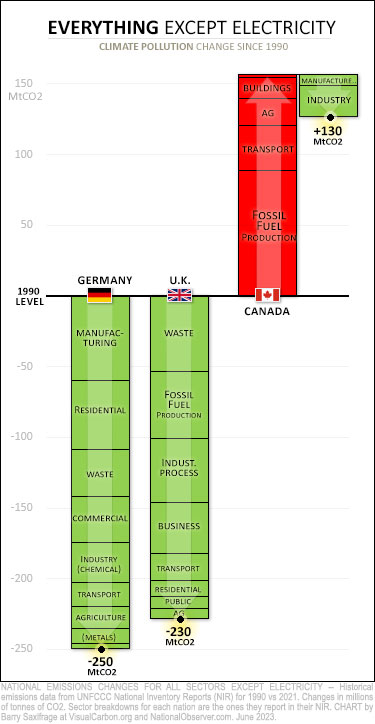
This chart shows each sector's climate pollution change since 1990 (except the electricity sector). Green shows reductions, red shows increases. And the height of each bar indicates the change in millions of tonnes of CO2 (MtCO2).
Notice anything?
The Germans and British have cut emissions in all sectors.
Canadians in contrast have increased emissions in most sectors — often by eye-watering amounts.
Canada's most out-of-control sector has been the extraction of fossil oil and gas, which now emits 90 MtCO2 more per year than in 1990.
Canada's next most out-of-control sector is transportation — caused by burning more fossil gasoline and diesel in our cars, trucks, jetliners and ships. Our transport pollution surged by 32 MtCO2. Meanwhile, the Germans and British both reduced their transportation emissions. Apparently, polluting less is possible. Canada just refuses to adopt the kinds of policies that have worked for our peers.
As the chart shows, Canada's only significant emissions reduction beyond the electricity sector has been in our heavy industry sector. But roughly half that decline was the result of shutting down a single adipic acid factory in 2009 (it's used to make nylon). That's not climate progress or helpful decarbonization. That's just pushing the problem somewhere else.
The bottom line is that climate pollution needs to fall to ZERO in ALL sectors. And we need to do it quickly if we want to preserve a safe and sane climate.
By allowing emissions to surge unchecked across most of our economy, Canada has left its citizens and businesses unprepared and strapped to a climate-pollution rocket ship.
Fortunately, the path to climate safety is well-known and simple at heart if we want to change direction. We need to stop burning all fossil fuels — everywhere — and instead electrify everything we do using clean, renewable electricity.
-------------------
Endnotes
For those who like a bit more of the nitty-gritty, here's a deeper dive into the role of electricity sector emissions in G7 nations.
With versus without electricity sector emissions.
These next two charts let you compare G7 emission trends — with and without the electricity sector.
The chart on the left shows all emissions. Note that Canada is the only one in this group still emitting more than in 1990. And especially note how Canada was the only one that increased emissions in the last decade (the 2010s) before the pandemic hit. All the other G7 nations made big emissions cuts in that decade. This left Canada even further behind.
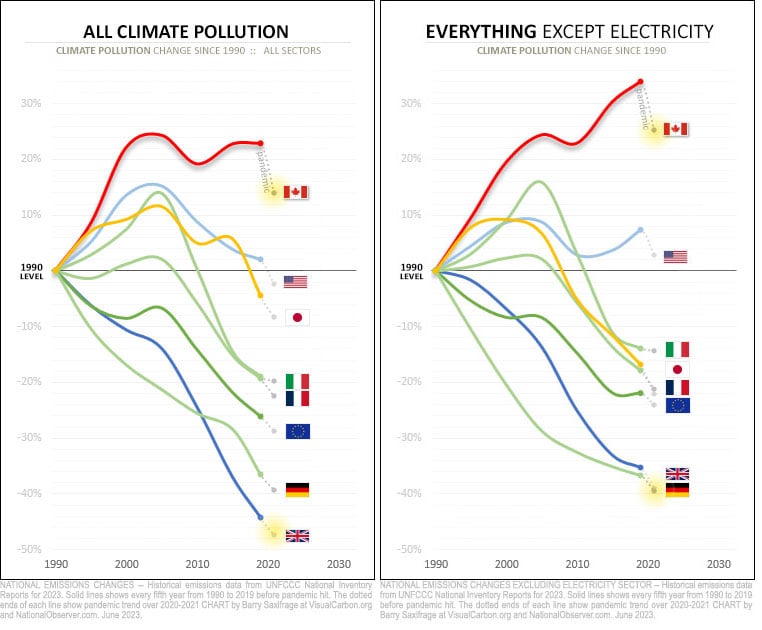
The chart on the right shows all national emissions except the electricity sector. Canada is the only one that allowed emissions outside the electricity sector to surge upwards to record levels before the pandemic hit. Also note that only Canada and the United States increased their non-electricity emissions during the 2010s decade. The rest of the G7 nations cut them. Canada's increase was much faster than the Americans'. Our failure to act significantly widened the gap between us and all our G7 peers.
Canada is even further behind with our non-electricity emissions.
Observant readers may have noticed that the gap between Canada and the other G7 nations is even larger when electricity emissions are excluded.
For example, here are the same two charts but with the gap between Canada and the U.K. highlighted by arrows.
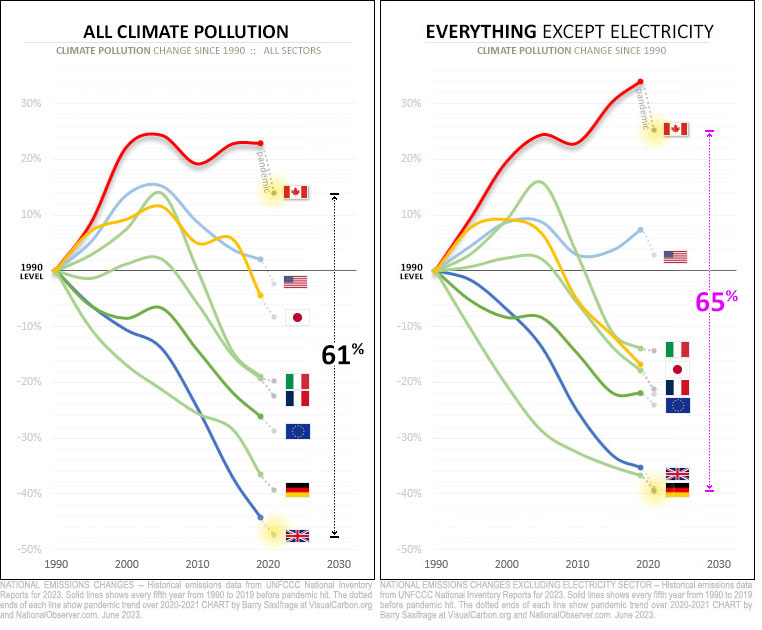
On the left, you can see that when we compare all emissions, Canada trails the British by 61 per cent — our emissions went up 14 per cent while theirs went down 47 per cent. The combined gap (14 + 47 = 61) is shown by a black arrow.
On the right chart, you can see that our gap with the British grows even larger — to 65 per cent — when we compare emissions outside the electricity sector. That's shown by the purple arrow.
This pattern is similar with all our G7 peers. Canada is further behind each nation when it comes to cleaning up our non-electricity emissions than we are with overall emissions. My last chart below shows this in detail.
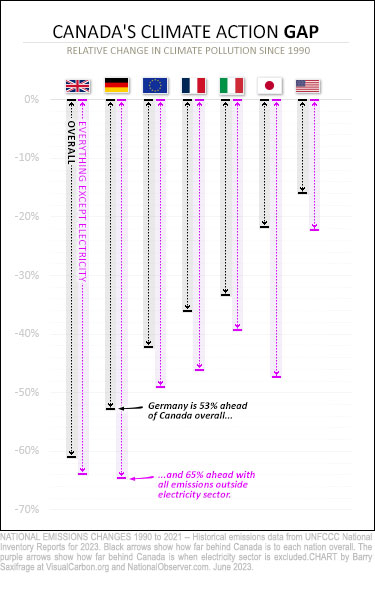
Black arrows show Canada's climate action gap when all emissions are compared.
The purple arrows show the gap when we compare emissions outside the electricity sector.
For example, with overall emissions, we are 53 per cent behind Germany. The gap grows to 65 per cent behind them when comparing emissions outside the electricity sector.
This shows that Canada has been the G7 nation that has relied most heavily on cutting electricity emissions to make climate progress. The flip side is that Canada has been doing the least to reduce climate pollution in the rest of the economy and society.
Pretty sad that a country
Pretty sad that a country like Canada can't even put a dent in climate change plan. I've had many doubts that this country will ever meet any targets set. There is too much misinformation, disinformation and greenwashing by the oil and gas sector. Too many people who can't tell the difference between fact and fiction. Unfortunately, Canada will be left behind, become the biggest emitter, while our PM continues to talk the talk, with little action to show for it. Of course, it would be far worse if the conservatives were in power.
Perhaps now that our Boreal
Perhaps now that our Boreal is going up in mucho smoke, we'll start reconsidering whether or not this True north nutty but free is really TOO BIG TO FAIL. Looks to me like its beginning to fail spectacularly...and sending copious clouds of noxious smoke to our BIG BROTHER to the south of us.....also too Big to Fail.
Currently, the mega size of our boreal is suggesting a conflagration too far, and we should be grieving...but PP will encourage us to civil strife as a distraction. Sucks to be Us.
What's even worse is that few
What's even worse is that few read the National Observer.....and the comment section is not interactive at all....so we don't get to have any black comedy relief, as the climate change deniers weigh in to quibble about the statistics.
I can't help but wonder what would change if articles like this one were to appear regularly on what we so blithely call our MSM??? Would our love affair with fossil fools like the Pathways Alliance wither??? Or would these stats be shot down by the true believers in Carbon Capture, Enhanced Oil Recovery, etc. etc.?
And Sask is busy building gas
And Sask is busy building gas plants (as a "transition fuel") ...
Moe has challenged the feds to "come and get him" because he has no intention of shutting down coal-fired power plants (or even installing CCUS!) by the deadline ... or for a long time after that.
Apparently, the way the new energy standards are constructed, that will be a criminal offense under the EPA. So he may just get his wish.
The provinces are much like people: let other people do the changes, because "everyone" has their own reason/excuse/whatever, their reason why they have to fly, their reason why they have to drive all weekend, in a gas-guzzler, no less ...
So you're writing with
So you're writing with absolute numbers, and Canada's non-electric emissions went up 30% while the population went up 48%, from 27 million in 1990, to 40 million today? (The UK population went up 17% in the same time.) That is, our per-capita non-electricity emissions went down 13% ?



Comments